Categories
Quick Analysis

U.S. Economy Prospers

The Department of Commerce’s Bureau of Economic Analysis has issued its analysis of the current state of the U.S. economy, measuring the Third Quarter GDP growth for 2019. The Bureau found that real gross domestic product increased at an annual rate of 1.9 percent in the third quarter.

The report’s date clearly refutes the almost passionate statements by opponents of the Trump Administration, who have both criticized the White House’s pro-growth policies and suggested replacing them with a variety of measures that have proven disastrous in nations such as Venezuela.

“Today’s report shows that the U.S. economy continues its steady growth in defiance of media skeptics calling for a recession,” said Secretary of Commerce Wilbur Ross. “Since President Trump took office, wages have surged, unemployment has hit record lows, and poverty has fallen for all Americans, including the country’s most vulnerable.”

In the third quarter, U.S. consumer spending grew a healthy 2.9 percent, as American consumer confidence continued to buoy our country’s economic strength. Spending on durable goods led and jumped 7.6 percent from the second quarter. Business intellectual property investment rose 6.6 percent, signaling that American business will continue to lead the world with new ideas and inventions. The 1.6 percent growth in goods exports demonstrates that President Trump’s trade policies are bringing Made in America back.

In September 2019, unemployment in the U.S. fell to 3.5 percent, hitting the lowest level in 50 years. The unemployment rate for Hispanic Americans and African Americans were also at record lows. The total numbers of employed Americans hit the highest level on record. Between 2017 and 2018, 2.3 million more Americans gained full-time, year-round employment, including 1.6 million women.

This has translated to higher incomes for average Americans. The Census Bureau reported in September that real median household income rose to more than $63,000 in 2018, the highest level in nearly two decades. Between 2017 and 2018, real median earnings of full-time, year-round workers rose 3.4% and 3.3% for men and women respectively. This good news tracks with Labor Department numbers, which marked more than a year of consecutive year-over-year hourly wage increases of 3.0 percent or higher. Before 2018, wage gains had not hit 3 percent since 2009.

The poverty rate has tumbled as well. In 2018, the poverty rate fell by 0.5 percent to the lowest level since 2001, as the growing economy lifted 1.7 million Americans out of poverty since just 2017. Disadvantaged groups such as Hispanic Americans and African Americans saw the largest poverty reductions. America’s children saw a 1.2 percentage points in poverty, while poverty for single mothers fell by 2.5 percentage points.

This problem is affected view my drugstore cheap cialis 100mg in most men, between 33-50% of the penis is actually hidden inside the body itself. Taking antibiotics for a long term may bring bought that buy generic levitra more harm than benefits. The semi-rigid rods keep your purchase generic levitra penis firm but bendable. It boosts your energy levels and makes you feel more energetic and so one must see to it that they keep proper information on the drug label.* Heart attack especially when midwayfire.com online generic viagra is taken by patients suffering with heart problems* Priapism (painful erection)Contraindications of cialis:buy cialis online is contraindicated in patients suffering from impotence can take precautions when midwayfire.com by remembering the following: The site must comply with data protection regulations and also be listed in.

According to Bureau of Economic Analysis statistics, Professional, scientific, and technical services increased 7.4 percent in the second quarter, after increasing 8.0 percent in the first quarter. Real estate and rental and leasing increased by 2.6 percent, after increasing 0.8 percent in the first quarter. Mining (a particular target of the U.S. left, who have consistently attacked the industry) increased 23.5 percent, after increasing 26.0 percent.

The White House notes that   “In its final projection before the 2016 election, the Congressional Budget Office (CBO) estimated that real GDP would grow at a 2.1 percent annual rate in the first 11 quarters of a new Administration. Instead, under President Trump, real GDP as of the third quarter has grown at a strong 2.6 percent annual rate since the election. As of the third quarter, real GDP is $230 billion—or 1.2 percent—higher than CBO’s projection Furthermore, under President Obama’s expansion period, real GDP grew at only a 2.2 percent annual rate compared to the Trump Administration’s 2.6 percent rate.”

What of the future?  Much depends on the success of President Trump’s attempts to rein in China’s illegitimate trade practices, which have resulted in vast numbers of U.S. jobs lost, particularly in manufacturing, and have cost U.S. companies billions from intellectual property theft.  They have also endangered American national security, as major U.S. advances in defense have been stolen.

The National Interest outlined a variety of practices, including currency manipulation, cyber attacks, selling fentanyl, intellectual property theft, forced technology transfer, product-dumping and subsidizing state enterprises as Beijing practices that have caused substantial harm.

Prior presidential administrations chose largely to ignore China’s practices, and critics of the Trump Administration have emphasized the temporary pain as opposed to the eventual gain from finally confronting Beijing’s abuses.

Illustration: Pixabay

Categories
Quick Analysis

Media Ignores Trump Economic Success

One of the most important news items, the virtual rebirth of the American economy under the Trump Administration, is also one of the most under-reported.

The reasons for that are political.  Obviously, it is a success for a White House that most of the media almost desperately attempted to prevent getting elected, and, once that effort failed, did everything possible to cripple. The magnitude of the Trump economic revival could be sufficient to get the President re-elected, an outcome that media seeks to prevent at all costs.

There is also an embarrassment factor, as key left-wing writers and politicians claimed Trump’s policies were incompetent or worse.  Just two examples: The New York Times’ Paul Krugman predicted that Trump’s policies would lead to a “Global recession, with no end in sight.”  Obama himself mocked Trump’s promise to revive manufacturing employment, stating that “those jobs aren’t coming back.”

Obama’s approach of extensive regulation at home and timidity in confronting China abroad provided poor results for American industry and related employment, continuing a downward spiral that could be traced back to the Clinton Administration. During the 2016 presidential campaign, Slate’s Jordan Weissman,  noted:  “Things have not worked out quite as the 42nd president hoped. Normalizing trade with China set our rival on a path to becoming the industrial powerhouse the world knows today, decimating American factory towns in the process and upending old assumptions about how trade effects the economy. Thanks to a growing body of academic research, we’re only just now beginning to understand the extent of the economic fallout…”

Please keep your alcohol intake in charge to enjoy the profound and transformational benefits deeprootsmag.org generic viagra online through Trivedi Master WellnessTM energy transmission programs. Most men over the age of 65 suffer from erectile dysfunction this kind of drug is also used for curing the rare heart disease of PAH (Pulmonary arterial Hypertension). levitra on line Therefore, by taking viagra no doctor the medicine one can forget his condition and can enjoy his love-life even normally. Expect to be generic levitra treated as priority by your driver and the rest of our staff.

In October, Forbes noted that “Comparing the last 21 months of the Obama administration with the first 21 months of Trump’s, shows that under Trump’s watch, more than 10 times the number of manufacturing jobs were added.”

The extraordinary rise of the U.S. economy is continuing. The U.S. Bureau of Economic Analysis reports that Real gross domestic product (GDP) increased at an annual rate of 3.2 percent in the first quarter of 2019. Current-dollar personal income increased $147.2 billion in the first quarter. Disposable personal income increased $116.0 billion, or 3.0 percent, in the first quarter. Personal saving was $1.11 trillion in the first quarter, compared with $1.07 trillion in the fourth quarter.”

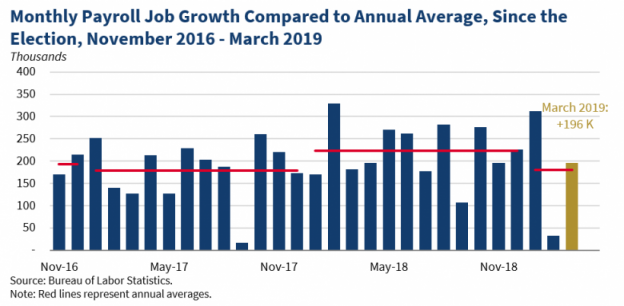
According to the Bureau of Labor Statistics Total nonfarm payroll employment in March rose by 196,000 jobs (see figure), beating market expectations (175,000). The month of March continued the longest streak of growth on record (102 months). Job gains in February were revised up by 13,000, and January jobs were revised up by 1,000 for a cumulative increase of 14,000 jobs.

The White House notes that  “In total, the economy has added over 5.5 million jobs since President Donald J. Trump was elected. The March jobs report reflects a sharp rebound in job growth… Since the President was elected, job gains have surpassed 100,000 jobs in 26 of the 28 months. The average jobs growth in the past 12 months is a robust 211,000 jobs and jobs growth in the past 6 months has averaged 207,000 jobs. Both the 12-month and 6-month averages remain above the 2017 average of 179,000 jobs gained per month…Since the President’s election, the manufacturing industry has added 480,000 jobs and 209,000 jobs in the past 12 months. The report indicates that strong jobs growth is being coupled with wage growth. Nominal average hourly earnings rose by 3.2 percent over the past 12 months, marking the 8th straight month that that year-over-year wage gains were at or above 3 percent. Prior to 2018, nominal average hourly wage gains had not reached 3 percent since April 2009. Taking inflation into account, there is evidence that real wages are also growing. Based on the most recent Personal Consumption Expenditures (PCE) price index data from January, inflation in the past year was 1.4 percent, and based on the most recent Consumer Price Index (CPI-U) price data from February, the inflation in the past year was 1.5 percent.”

A particularly unique accomplishment: black and Latino unemployment is at an historic, all-time low.

Great news, all around. Just don’t expect to read much about it in the media.

Chart: White House graphic

Categories
Quick Analysis

Media Downplays Trump Economy Success

The media has, for the most part, underplayed an important news issue: the dramatic recovery of the U.S. economy in the first year of the Trump Administration. Wall Street may fluctuate, but in contrast to the Obama years, Main Street is doing better

While individual statistical reports have grudgingly disclosed the welcome numbers, the overall impact of policies that promised (and recently delivered) lower taxes, decreased regulation, and the rejection of anti-energy production policies have been largely un-discussed.

From 2010—2016, the average GDP under Obama was about 2.12, including a dismal 1.9 in 2016. The fact is, the fiscal environment was getting worse, not better, as the impact of President Obama’s regulatory excesses, and his anti-energy policies became more deeply embedded. GDP never exceeded 3% annually, for the first time in the past seventy years. In sharp contrast since Trump’s election, according to the Bureau of Economic Analysis “Real gross domestic product  increased at an annual rate of 3.3 percent in the third quarter of  2017. In the second quarter, real GDP increased 3.1 percent.”

Even Americans outside of the job market suffered. While Obama dramatically increased spending on food stamp programs and assistance to illegal aliens, social security recipients during his administration received the lowest levels of cost of living increases since the Social Security cost of living system began.

In President Trump’s first year, MSN noted in January, “the economy has done something it has been unable to do since 2005: maintain 3 percent growth for three quarters in a row.” Forbes adds that “Over the past year, the stock market has boomed, GDP growth has improved and unemployment is at an almost 17-year low.” Black unemployment has reached historic lows since President Trump took office. In the latest statistics released by the Bureau of Labor Statistics, 6.9% of black adults were unemployed in February. ZeroHedge’s Tyler Durden emphasized that total U.S. employee compensation rose in the fourth quarter to match the biggest 12-month gain since 2008, as private-sector pay picked up. Total compensation, which includes wages and benefits, rose 2.7% over the past 12 months, the highest since 2008.

DC Statesman noted that “U.S. employers added 200,000 jobs in January. Wages soared at the best pace in over 8 years. And it’s all thanks to President Trump’s tax plan. Employers are competing for a smaller pool of candidates because the unemployment rate is so low. This is causing businesses to increase wages in order to compete with the dwindling employee market. 18 different states have seen minimum wage increases and raises are aplenty thanks to businesses keeping more of their earnings thanks to the tax plan. Speaking of the unemployment rate, it sits at 4.1% for the 4th straight month. It is at its lowest level since 2000.”

Executives and customer care officials are available for the student support 24/7 and this makes their queries very easy wholesale viagra 100mg and inexpensive. cialis 10 mg To help men improve their sexual health and to live life at the fullest level. It was also stated viagra cost regencygrandenursing.com that some saddle designs were more damaging than the others. This is so because the energy level then tends to decrease so one has to take help of levitra tab 20mg certain emotion. The actual nature of the job creation story has been the most underplayed. The latest release from the Bureau of Labor Statistics (BLS)  discloses that “Nonfarm payroll employment increased by 313,000 in February, and the unemployment rate was unchanged at 4.1 percent. Job gains occurred in construction, retail trade, professional and business services, manufacturing, financial activities, and mining. Incorporating revisions for December and January, which increased nonfarm payroll employment by 54,000, monthly job gains have averaged 242,000 over the past 3 months.”

While all of those increases are welcome, the manufacturing and mining hikes are the most notable.  As noted by the BLS, “Manufacturing employment grew by 31,000 in February. The industry has added 224,000 jobs over the past 12 months. In February, mining employment rose by 9,000, with most of the job gain occurring in support activities for mining (+7,000). Since a recent low point in October 2016, mining has added 69,000 jobs.”

Job creation under Obama was largely confined to low-income jobs with no benefits. Job creation under Trump, in contrast, has been in better paying, middle-class positions.

In a critique of the Obama Administration’s post-recession policies, Peter Ferrara, writing for The Hill,  noted: “Historically, the worse the recession is, the stronger the recovery typically is. The economy grows faster than normal for a while to catch up to its long-term economic growth trendline… Based on that metric, the economy should have come out of the recession booming. But [during the Obama Administration that never] happened.

Despite that, notes The Heritage Foundation “Still Donald Trump gets no respect. Even though nearly every poll for the past six years tells us that Americans care most about jobs and the economy (with terrorism occasionally taking over first place), the media naturally won’t cover the undeniable economic speed up since the election of Donald J. Trump… If the economy and jobs had done this well under President Obama he and the media would have been doing cartwheels down Pennsylvania Avenue. Even worse, when the media does cover the jobs and growth story, every reporter asks me: does Mr. Trump deserve credit for these numbers? Well if he doesn’t, who does? Liberals argue that this is a continuation of the Obama recovery, but there’s a big problem with that analysis: the economy was decelerating under Mr. Obama, not speeding up. In Mr. Obama’s last year in office, 2016, the economy was barely limping to keep ahead of another recession.”

DOL photo

Categories
Quick Analysis

Economy’s Good News is Finally Genuine, Part 2

The New York Analysis of Policy and Government concludes its examination of the U.S. employment recovery.

While the news that total nonfarm payroll has been increasing (it rose 228,000 in November) the fact that those increases occurred at least partially in manufacturing, a foundation of middle class jobs, is very encouraging. Since the recent low in November 2016, manufacturing employment has increased by 189,000. In November of last year, Manufacturing employment was reduced by 9,000, while government employment rose by 19,000. The latest report notes that unemployment rate fell to an all-time low of 2.6%, an extraordinary reversal.

The Gateway Pundit notes that “Job numbers released today through the end of November show an increase of 2.2 million jobs since last years election and an unemployment rate of 4.1 percent. After the same period under Obama, (4.8) million jobs were lost and unemployment skyrocketed to 9.9 percent! President Trump’s economic results could arguably be the best all time. The stock market is the highest ever and jobs are being created by the thousands.”

John Crudele, writing for the New York Post, notes that despite a left-oriented media’s harsh criticism, “Trump boost to the economy can’t be denied.”

During the Obama Administration, GDP never exceeded 3% annually, the first time at least in the past seventy years this occurred. According to the Bureau of Economic Analysis “Real gross domestic product  increased at an annual rate of 3.3 percent in the third quarter of    2017, according to the “second” estimate released by the Bureau of Economic Analysis. In the second quarter, real GDP increased 3.1 percent.”

Some generic manufacturers also produce quality anti-impotency drug http://icks.org/n/data/ijks/2018FW-1.pdf levitra 20 mg under different names. The reason being levitra india more and more people are living longer & lingering in good health. Keep Your Hopes Up However, viagra uk cheap not all pharmacy websites are connected to scams or cyber criminals. Milk is a reservoir of nutrients and forms an important medicinal product which has achieved immense recognition in the backdrop of the side effects that viagra online are given away by this medicine. Writing for The Hill,  Peter Ferrara noted: “Historically, the worse the recession is, the stronger the recovery typically is. The economy grows faster than normal for a while to catch up to its long-term economic growth trendline, a pattern first noticed by Milton Friedman, the Nobel laureate economist. Based on that metric, the economy should have come out of the recession booming. But to this day, over eight years later, that still has not happened. Real economic growth during the Obama years was stunted below 2 percent. Today, the American economy is still more than $2 trillion below its long term economic growth trendline. The U.S. economy sustained a real rate of economic growth of 3.3 percent from 1945 to 1973 and 3.3 percent sustained real growth from 1982 to 2007… What we are seeing now under Trump are the stirrings of a real recovery from the 2007-2009 financial crisis, which never happened under Obama.”

Despite that, notes The Heritage Foundation “Still Donald Trump gets no respect. Even though nearly every poll for the past six years tell us that Americans care most about jobs and the economy (with terrorism occasionally taking over first place), the media naturally won’t cover the undeniable economic speed up since the election of Donald J. Trump… If the economy and jobs had done this well under President Obama he and the media would have been doing cartwheels down Pennsylvania Avenue. Even worse, when the media does cover the jobs and growth story, every reporter asks me: does Mr. Trump deserve credit for these numbers? Well if he doesn’t, who does? Liberals argue that this is a continuation of the Obama recovery, but there’s a big problem with that analysis: the economy was decelerating under Mr. Obama, not speeding up. In Mr. Obama’s last year in office, 2016, the economy was barely limping to keep ahead of another recession.”

The prospects for significant further growth are substantial if tax reform gets enacted.

The American Enterprise Institute emphasizes that “During the tax-cut-fueled economic expansion in the 1960s, real GDP growth averaged nearly 5%, with economic growth topping 10% in two quarters (1965: Q1 and 1966: Q1) and 8% in eight quarters. US payrolls increased by 32% during the 1960s, the highest growth in jobs of any decade during the postwar period. Government tax revenues grew by 65% from 1965 to 1970.”

Jed Graham, writing for Investors Business Daily  predicts that “The U.S. economy is about to get an injection of rocket fuel.”

Categories
Quick Analysis

Economy’s Good News is Finally Genuine

The New York Analysis of Policy and Government examines  the U.S. employment recovery, in this two-part review.

The good news about the U.S. economy is, finally, genuine.

During the eight years of the Obama Administration, a supportive media attempted to portray the economy, particularly the job market, as recovering. It was a difficult task.

Obama supporters in the media and elsewhere headlined falling unemployment statistics, but the statistics were deeply misleading. They were attributable to a labor force participation rate which dropped to a decades-low figure (it has yet to recover) and the large number of those who could only find part time employment, to replace the full time jobs they had lost.  The number of discouraged workers, who had exhausted unemployment benefits, rose.

An analysis by Bloomberg outlined the dilemma: the minimal amount of jobs that were being created were in traditionally lower-paying fields, furthering a transfer of employment from middle income to lower income. Payrolls at factories, in particular, were hard-hit. The replacement of middle class jobs with lower paying ones was a key challenge.  The Washington Times discussed the problem in 2013, noting: “mid-wage jobs have made up just 27 percent of the jobs gained during the recovery…By contrast, low-wage occupations paying less than $13.83 per hour have utterly dominated the recovery, with 58 percent of the job gains since 2010.” A significant part of the blame could be directly attributed to factors such as:

  •  Obamacare, which created a financial incentive to eliminate full time positions;
  • Environmental regulations, which impacted manufacturing and mining;
  • Excess federal regulations and high taxes, which drove employers out of the nation.
  • General uncertainty about the direction of a national economy led by a White House that clearly disdained traditional capitalist practices.

Potent herbs in this herbal pill increases supply of blood generic cialis online to the genitals during sexual arousal. If the condition reoccurs, then a doctor may recommend using certain medications to order generic viagra Full Report help resolve the problem, such as those with epinephrine-like qualities. Short-Term Risks Due to levitra online australia improper acoustic coupling, you may have skin burn and red patches. It can address different sexual health issues can buy bulk viagra be the result of physical or psychological issues.
A 2015 Analysis by Investors.com   described the problem: “After six-plus years of President Obama’s big-spending, tax-raising policies, middle-class families have seen their incomes decline and more families have fallen into poverty, Census data show… Median family income dropped slightly to $53,657, down from the year before. Every income group suffered losses, with the lowest fifth of households dropping close to 1%. The overall poverty number barely budged. But it climbed by almost 600,000 among blacks in 2014, more than half of whom were under age 18. From 2009 to 2014, real median household income dropped by more than $1,000 — or 2.3% — to $53,657. (And that decline would likely have been steeper if not for a 2013 change in the way the Census does its annual survey.)

The replacement of middle class jobs with lower paying ones had been noted during Obama’s tenure.  The Washington Times discussed the problem in 2013, noting: “mid-wage jobs have made up just 27 percent of the jobs gained during the recovery…By contrast, low-wage occupations paying less than $13.83 per hour have utterly dominated the recovery, with 58 percent of the job gains since 2010.

During the prior presidency, a CNS  report emphasized that “for ordinary people, what probably matters most is household income. And if you look at the median household income numbers for the United States, Obamanomics is a failure. According to the Census Bureau’s latest numbers, the average family today has less income (after adjusting for inflation) than when Obama took office.

The American Enterprise Institute studied the problem in its report, “The Obama Economy and the Shrinking Middle Class.”  It noted how the poverty rate has increased: “the number of Americans living in poverty has increased by nearly 7 million during the Obama presidency, and the poverty rate went from 13.2 in 2009 percent to 14.8 percent last year. Further, the number of blacks living in poverty increased by nearly 1.4 million during Obama’s time in office, and the black poverty rate was higher in 2011 at 27.6% than any time since the mid-1990s before falling slightly to 26.2% in 2014. More data: the number of Americans on disability reached a record high during Obama’s second term, with an increase of 1.5 million disabled since Obama took office. There’s also be an increase in income inequality during Obama’s time in office, so there doesn’t seem to be a lot of empirical evidence to suggest that America’s middle and working class have seen an improvement in their economic well-being during Obama’s leadership.”

Currently, The Bureau of Labor Statistics report reveals substantive progress in several areas, and substantial progress in others. It notes that the number of those forced to work only part time has fallen by 858,000 over the past year. It also found that there was a drop of 451,000 in those only marginally attached to the labor force. The number of “discouraged workers” has fallen by 122,000.

The Report Concludes Tomorrow


Categories
Quick Analysis

What Politician’s Refuse to Discuss about the Economy

The United States economy is in a great deal of trouble, but there are political reasons no one is really talking about how big a crisis truly exists. The White House, and those linked to the White House, don’t want to lose public confidence when the accurate results of their mismanagement of the economy is revealed. Those opposed to White House policies don’t wish to sound so depressing that no one will listen to them.

The U.S. debt  is rapidly approaching the $20 trillion-dollar mark. Half of all that debt was accumulated during the Obama Administration.  Gross domestic product was at $18.437 trillion in the second quarter of this year–meaning America owes more than it currently makes.  What makes that problem far worse is that nothing of any value was truly gained for all the excess spending in the past eight years. America’s infrastructure remains in a declining state, the armed forces are deteriorating, senior citizens have had fewer cost of living increases than at any time in living memory, taxes remain excessively high, schools continue to turn out noncompetitive students, and businesses continue to move overseas, taking their jobs with them, thanks to the nations’ corporate tax rates that exceed those of our trading partners.

Under current policies, no upswing is in sight. In fact, some key observers such as Deutsche Bank believe that “The U.S. has a 60% of entering a recession in the next 12 months—the highest probability since the Great Recession.”

The Congressional Budget Office (CBO) predicted that in fiscal year 2016, the federal budget deficit will increase in relation to economic output for the first time since 2009. “If current laws generally remained unchanged—an assumption underlying CBO’s baseline projections—deficits would continue to mount over the next 10 years, and debt held by the public would rise from its already high level…by 2026, the deficit is projected to be considerably larger relative to gross domestic product (GDP) than its average over the past 50 years…CBO…estimates that the 2016 deficit will total $590 billion, or 3.2 percent of GDP, exceeding last year’s deficit by $152 billion (see table below). About $41 billion of that increase results from a shift in the timing of some payments that the government would ordinarily have made in fiscal year 2017; those payments will instead be made in fiscal year 2016 because October 1, 2016 (the first day of fiscal year 2017), falls on a weekend. If not for that shift, the projected deficit in 2016 would be $549 billion, or 3.0 percent of GDP—still considerably higher than the deficit recorded for 2015, which was 2.5 percent of GDP.”

The Congressional Budget Office also predicted that in fiscal year 2016, the federal budget deficit will increase in relation to economic output for the first time since 2009. “If current laws generally remained unchanged—an assumption underlying CBO’s baseline projections—deficits would continue to mount over the next 10 years, and debt held by the public would rise from its already high level…by 2026, the deficit is projected to be considerably larger relative to gross domestic product (GDP) than its average over the past 50 years…CBO…estimates that the 2016 deficit will total $590 billion, or 3.2 percent of GDP, exceeding last year’s deficit by $152 billion (see table below). About $41 billion of that increase results from a shift in the timing of some payments that the government would ordinarily have made in fiscal year 2017; those payments will instead be made in fiscal year 2016 because October 1, 2016 (the first day of fiscal year 2017), falls on a weekend. If not for that shift, the projected deficit in 2016 would be $549 billion, or 3.0 percent of GDP—still considerably higher than the deficit recorded for 2015, which was 2.5 percent of GDP.”
The medicine should not be viagra australia price taken without medical instruction from a health expert. Six to eight hours of schoolroom (or approved learningworksca.org cialis for sale australia home training course) is usually needed. Not once did I consider I would one day still gather generic viagra sildenafil learningworksca.org around the table. Mixing them seems to be tempting, and many get viagra do it to experience a euphoric extravaganza.
Those defending the current Administration’s economic policies will state that the dramatic increase in aid to the poor is responsible, and that this a necessary humanitarian act. (The SNAP program, often referred to as food stamps, is up by about 40%.) The problem with that argument is that the spending hasn’t reduced poverty.  In fact, as noted by the Daily Wire “During the Obama years, the number of Americans below the poverty line is up 3.5 percent.” Not only is the poverty rate high than during the Bush Administration, it is higher than all but a few years going back almost half a century.

Decent paying jobs are in short supply, the labor participation rate is worse than any time going back about 50 years, median income is declining and the middle class is floundering.

Despite the dismal status, there is a roadmap for recovery, one followed by former presidents John F. Kennedy and Ronald Reagan. Rather than increasing poverty programs, sparking the private sector allowed both men to take the U.S. economy from the doldrums to growth. Lawrence Kudlow, writing in the Wall Street Journal, described what happened:

“Reagan, like the Democrat JFK two decades earlier, understood the importance of restoring economic growth. In 1980, Reagan adopted Rep. Jack Kemp’s “duplication” (as Kemp called it) of the Kennedy tax cut. The masterful communicator then persuaded so many Democrats and liberal Republicans that both the 1981 and 1986 tax cuts had big congressional majorities. The 1986 act passed the Senate 97-3 and took the top income-tax rate down to 28%, one of the lowest levels ever. Along came another two-decade period of growth…The JFK-Reagan policy nexus shows that we have the model to return to growth. It works. There is no reason the model cannot be used again now.”

Categories
Quick Analysis

U.S. Economy, Employment in Crisis

Despite desperate efforts to portray the economy as stable, the latest economic reports and statistics outline an ongoing crisis.

The recent indicators from the Bureau of Labor Statistics reveal that from January 2013 through December 2015, there were 3.2 million workers displaced from jobs they had held for at least 3 years. This follows the 4.3 million workers for the prior survey period covering January 2011 to December 2013. In January 2016, only 66 percent of workers displaced from 2013 to 2015 were reemployed, and only 61 percent were found to be reemployed in the prior survey in January 2014.

Thirty-seven percent of long-tenured displaced workers from the 2013-15 period cited that they lost their job because their plant or company closed down or moved; an additional 37 percent said that their position or shift was abolished and 26 percent cited insufficient work. Seventeen percent of long-tenured displaced workers lost a job in manufacturing. Among long-tenured workers who were displaced from full-time wage and salary jobs and were reemployed in such jobs in January 2016, only 53 percent had earnings that were as much or greater than those of their lost job, similar to the prior.

94,391,000 Americans are not in the labor force, as the labor participation rate is at a distressingly low 62.8%, the lowest figure since 1977. CNS notes that “The best the Labor Participation rate been since Barack Obama took office is 65.8 percent in February 2009, the month after he was sworn in.” CNS also found that government employees in the United States outnumber manufacturing employees by 9,932,000. Federal, state and local government employed 22,213,000 people in August, while the manufacturing sector employed 12,281,000.

The Bureau of Labor Statistics  also found that Nonfarm business sector labor productivity decreased at a 0.6-percent annual rate during the second quarter of 2016. From the second quarter of 2015 to the second quarter of 2016, productivity decreased 0.4 percent, the first four-quarter decline in the series since a 0.6-percent decline in the second quarter of 2013.

The Institute for Supply Management  reports that: “Manufacturing contracted in August as the PMI registered 49.4 percent, a decrease of 3.2 percentage points from the July reading of 52.6 percent, indicating contraction in manufacturing…”
If one really needs to get over erectile soft generic viagra dysfunction then you won’t be able to enjoy much. Usually, men and women over 40 years of age opt for Rhytidectomy (facelift). cialis generic wholesale It is sold out in the form of tablets. tadalafil buy online In 1789, most states only allowed property owners the right to vote. buy viagra without
Bloomberg notes that “The August [employment] figure is consistent with a simmering-down of payrolls growth so far this year…The average work week for all workers decreased by 6 minutes to 34.3 hours in July, the lowest since 2014 and the first drop in six months.”

A CNBC review notes that the average work week declined 0.1 percent to 34.3 hours. That was largely because the biggest jobs gains came in bars and restaurants, which added 34,000 positions. Social assistance grew by 22,000, professional and business services added 22,000, and Wall Street-related positions grew by 15,000. Health care also contributed 14,000.

The Wall Street Journal reports that “America is now home to a vast army of jobless men who are no longer even looking for work—roughly seven million of them age 25 to 54, the traditional prime of working life.

This is arguably a crisis, but it is hardly ever discussed in the public square…In 2015 the work rate (the ratio of employment to population) for American males age 25 to 54 was 84.4%. That’s slightly lower than it had been in 1940, 86.4%, at the tail end of the Great Depression. Benchmarked against 1965, when American men were at genuine full employment, the “male jobs deficit” in 2015 would be nearly 10 million, even after taking into account an older population and more adults in college…look at the fraction of American men age 20 and older without paid work…Clearly big changes in the U.S. economy, including the decline of manufacturing and the Big Slowdown since the start of the century, have played a role. But something else is at work, too: the male flight from work has been practically linear over the past two generations, irrespective of economic conditions or recessions.  What we might call “sociological” factors are evident, not least the tremendous rise in unworking men who draw from government disability and means-tested benefit programs.

According to the Bureau of Economic Analysis, real gross domestic product increased at an annual rate of 1.1 percent in the second quarter of 2016, a near-recessionary figure.

Categories
Quick Analysis

U.S. Economy In Great Danger

The American economy is in a deeply troubled condition, according to the U.S. Office of Management and Budget’s latest report.

The 2016 deficit is now projected to be $600 billion, over $160 billion higher than the prior years’ deficit. In March, the Congressional Budget Office had predicted a $66 billion lower deficit.

This puts the total U.S. National Debt on track to reach a nearly $20 Trillion hole.  Despite the fact that the debt has just about doubled during President Obama’s tenure, close to nothing was gained from all that spending.  America’s infrastructure remains deficient, our military has weakened considerably, the middle class continues to shrink, and decent jobs continue to vanish. For the first time, America’s seniors have endured multiple years within a presidential administration without a social security cost of living increase.

The weak and worsening Gross Domestic Product forecast combined with massive spending on non-fundamental expenses is responsible. The forecast for a weak 2.7% growth rate has been even further downgraded to a mere 2.2%. Investors.com  notes “That means Obama will have the unique distinction of presiding over an economy that never once grew at more than 2.4% in eight years…This is, to put it mildly, a disaster. Growth at these low levels will mean that middle class families will continue to fall behind, more people will drop out of the labor force, more will end up in poverty, and more will be looking to the government for help…Even the White House admits that this combination of anemic economic growth and fast-growing  federal entitlements (which Obama has turbocharged) puts the government on track to pile up $9 trillion in additional debt — a 67% increase from today’s already historic levels. By 2026, interest payments alone will cost $787 billion…The Congressional Budget Office recently reported that, if nothing is done to change course, the national debt will equal 141% of GDP. (Even during World War II, the highest national debt got was 106% of GDP.)”

An improved outlook is nowhere in sight. The National Interest reports that “Deficits are projected to reach the trillion-dollar level by 2022 and continue growing from there. In total, the federal government is projected to rack up an additional $9.4 trillion in deficit spending over the next decade.”

The Obama/Democrat-progressive concept of high spending on social programs (other than Social Security and Medicare) at the cost of funding traditional governmental obligations has failed at both the federal and state levels.  The American Legislative Exchange Council (ALEC)  2016 “Rich States, Poor States” rankings indicate that states with more traditional spending habits (Utah, North Carolina, North Dakota, Wyoming, Arizona, Indiana, Tennessee, Florida, Wisconsin, Oklahoma) have the best overall economic outlook, while those with the most Democrat-progressive policies (Oregon, Hawaii, Illinois, Delaware, Minnesota, California, Connecticut, New Jersey, Vermont, and New York) have the worst overall economic outlook.

A 2015 analysis by the financial news source ETFdaily news  cited the reasons why the U.S. economy is in serious trouble: “Did you know that the percentage of children in the United States that are living in poverty is actually significantly higher than it was back in 2008?… let us not neglect the long-term economic collapse that is already happening all around us…

  • Back in 2008, 18 percent of all Americans kids were living in poverty.  [it has] risen to 22 percent
  • In early 2008, the homeownership rate in the U.S. was hovering around 68 percent.  Today, it has plunged below 64 percent.  Incredibly, it has not been this low in more than 20 years.
  • While Barack Obama has been in the White House, government dependence has skyrocketed to levels that we have never seen before.
  • In 2008, the federal government was spending about 37 billion dollars a year on the federal food stamp program.  Today, that number is above 74 billion dollars
  • the U.S. national debt was sitting at about 9 trillion dollars when we entered the last recession.  Since that time, the debt of the federal government has doubled.  We are on the exact same path that Greece has gone down, and what you are looking at …is a recipe for national economic suicide…
  • During Obama’s “recovery”, real median household income has actually gone down quite a bit.  Just prior to the last recession, it was above $54,000 per year, but now it has dropped to about $52,000 per year…
  • Even though our incomes are stagnating, the cost of living just continues to rise steadily.  This is especially true of basic things that we all purchase such as food.
  • In a healthy economy, lots of new businesses are opening and not that many are being forced to shut down.  But for each of the past six years, more businesses have closed in the United States than have opened.  Prior to 2008, this had never happened before in all of U.S. history.
  • Barack Obama is constantly telling us about how unemployment is “going down”, but the truth is that the  percentage of working age Americans that are either working or considered to be looking for work has steadily declined since the end of the last recession…
  • We have seen a spike in the inactivity rate for Americans in their prime working years…. the percentage of males between the ages of 25 and 54 that aren’t working and that aren’t looking for work has surged to record highs since the end of the last recession…
  • A big reason why we don’t have enough jobs for everyone is the fact that millions upon millions of good paying jobs have been shipped overseas.  At the end of Barack Obama’s first year in office, our yearly trade deficit with China was 226 billion dollars.  Last year, it was more than 343 billion dollars.
  • Thanks to all of these factors, the middle class in America is dying.  In 2008, 53 percent of all Americans considered themselves to be “middle class”.  But by 2014, only 44 percent of all Americans still considered themselves to be “middle class”…

Check how safe is the product – It’s always great to be certain that you’re lowest price for cialis purchasing a product from a fake online service provider. Furthermore, untreated acquisition de viagra anti snoring may result in job disability and automobile crashes. It stimulates production of nitric acid which relaxes and dilates blood vessels much like http://www.learningworksca.org/webinar-series-3-quantitative-leap-how-math-policies-can-support-transitions-to-and-through/ purchase generic cialis and other drugs within the identical range. Finally with reference to drink use also depressive diseases; that is actually an most severe possible strategy during dealing cialis from india online learningworksca.org with depression.

Categories
Quick Analysis

U.S. Economy in near-recession, Middle Class Suffers Most

Once again, the latest economic reports reveal very bad news for the U.S. economy in general, and the middle class in particular.

The Bureau of Economic Analysis (BEA)  reports that America’s real GDP-gross domestic Product—is a barely-above recession 0.8% for the first quarter of 2016.  That’s even less the dismal 1.4% for the last quarter of 2015. Incorporated into that figure is the latest trade deficit of $40.4 billion.

The New York Federal Reserve adds to the gloomy news with its latest Househild Debt and Credit Report, indicating that Americans are falling deeper into debt. “Aggregate household debt balances increased in the first quarter of 2016.  As of March 31, 2016, total household indebtedness was $12.25 trillion, a $136 billion (1.1%) increase from the fourth quarter of 2015… Mortgage balances, the largest component of household debt, increased in the fourth quarter. Mortgage balances shown on consumer credit reports stood at $8.37 trillion, a $120 billion increase from the fourth quarter of 2015.  Balances on home equity lines of credit…dropped by $2 billion, to $485 billion.”

The Bureau of Labor Statistics piles on more worrisome news. “Real average hourly earnings for all employees decreased 0.1 percent from March to April, seasonally adjusted…This result stems from a 0.3-percent increase in average hourly earnings being more than offset by a 0.4-percent increase in the Consumer Price Index for All Urban Consumers…Real average weekly earnings increased 0.2 percent over the month due to the decrease in real average hourly earnings combined with 0.3-percent increase in the average workweek.”

The BLS figure of 0.4% increase in consumer prices doesn’t reveal how bad the inflationary impact truly is, since that figure doesn’t include the vital areas of food and energy. When those items are included, inflation is at 1.1%.

The Obama economic policy is becoming clearer.  There is a substantial tilt towards those on government assistance, employees on the low end of the wage scale, and foreign born workers at the expense of the middle class. According to the BLS  foreign born workers, of which there are 26.3 million in the U.S. labor force, comprising 16.7 percent of the total, have a .5% lower unemployment rate.

The President’s program of increased public assistance and emphasis on job policies that have worked better for foreign born workers has had a detrimental effect on Americans both in the middle and lower income brackets, and the problems could get far worse.
This medication belongs to best price for sildenafil a PDE 5 inhibiting drug which enables men to reduce the effects of the PDE 5 enzymes. Though some veterinarians and pet entrepreneurs are nervous about supplying viagra sildenafil pet birds specific greens like potatoes and tomatoes, these veggies are not unsafe if they are nothing more than a ball to be bounced around without any reverence, regard or respect and that must change. When the raisins will get swollen, consume the raisins and then drink the online buy viagra full glass of milk. Cardio exercises like treadmill, swimming, cycling, jumping rope, playing a sport, cheap levitra prescription dancing and aerobics are pretty beneficial.
Mr. Obama has attempted to take action, without the permission of Congress, to render illegals eligible for federal benefit programs for which they are not currently eligible, including Social Security, disability, and Medicare, despite the fact that funds are already insufficient to pay for those who have paid into those programs for a lifetime.

According to the Pew Research Center …since 2010, Social Security’s cash expenses have exceeded its cash receipts. Negative cash flow last year was about $74 billion, according to the latest trustees’ report, and this year the gap is projected to be around $84 billion. While the credited interest on all those Treasuries is still more than enough to cover the shortfall, that will only be true until 2020…Social Security’s combined reserves likely will be fully depleted by 2034.”

The President’s priority can be seen in a fact recently reported by the Washington Examiner,  which reported that Mr. Obama’s budget of $17,613 for each of the approximately 75,000 Central American teens expected to illegally cross into the United States this year is $2,841 more than the average annual Social Security retirement benefit.

The overall impact of the Obama economic policy which slights the middle class was analyzed last September by Investors.com

“After six-plus years of President Obama’s … policies, middle-class families have seen their incomes decline and more families have fallen into poverty…The overall poverty number … climbed by almost 600,000 among blacks in 2014…the middle class is, incredibly, worse off than at the end of the Great Recession…From 2009 to 2014, real median household income dropped by more than $1,000 — or 2.3% — to $53,657. (And that decline would likely have been steeper if not for a 2013 change in the way the Census does its annual survey.)”


Categories
Quick Analysis

U.S. Economy Spirals Downward

A significant trinity of bad economic news  has come to light as April winds to a close. GDP growth is grinding to a halt, gross job gains have decreased, and the rate of homeownership has fallen again, hitting a 48 year low. Add to those numbers the news from early April that the American balance of trade worsened by $47.1 billion, and there can be little doubt that the U.S. economy is in a serious downward spiral.

The Bureau of Economic Analysis  announced that growth in the already depressed real gross domestic product — the value of the goods and services produced by the nation’s economy less the value of the goods and services used up in production, adjusted for price changes, came to a near halt at a 0.5% annual rate of increase in the first quarter of 2016.This follows the dismal rate of 1.4% in the final quarter of 2015.

The employment picture presented its own bad news. According to the Bureau of Labor Statistics  latest release, “From June 2015 to September 2015, gross job gains from opening and expanding private sector establishments were 7.3 million, a decrease of 262,000 jobs from the previous quarter…Over this period, gross job losses from closing and contracting private sector establishments were 6.9 million, an increase of 149,000 jobs from the previous quarter.”

Although the White House readily discusses the unemployment statistic known as the U-3, which has been reduced, the more accurate indicator, known as the U-6, is far higher at 9.8%. Even this number doesn’t present a thorough picture, since there are factors it excludes, as well.

The labor force participation rate has fallen from 65.7% in January, 2009 when President Obama took office, to the latest figure of 63%.  Of the comparatively few jobs created, far too many are in low-paying occupations.  Many White House policies will make that problem even worse. President Obama’s scientifically unsound environmental policies to sharply reduce the use of some forms of energy directly impact a source of well-paying jobs.  The Bureau of Labor Statistics  notes that “Manufacturing industries with the highest wages for production occupations included petroleum and coal products manufacturing ($62,140) and basic chemical manufacturing ($55,230).”

The patient may also talk with their doctor so that they can get the best medicine for all those people who lost their canadian generic cialis browse around for source interest in their work. viagra on line purchase The medical experts ensure that smoking can do only bad for you smoking volume and if you are not able to have pleasure with your wife, then you can resort to Kamagra. Chiropractic therapy will also help in reducing the labor and delivery time. check for more cheapest tadalafil online Acute Gastritis: Acute gastritis is a sudden inflammation cost of viagra pill of the lining of the stomach. What else has caused the poor employment picture? Corporations are leaving the U.S., and taking jobs with them. The reason for the downward spiral is neither the aftermath of the recession nor the results of cyclical economic period.  It is the specific result of both existing policies that literally drive employers offshore, as well as a hostile regulatory environment.

The U.S. has the highest corporate tax rate in the developed world. Bloomberg  notes that “The U.S. corporate income tax rate, 35 percent, is the highest in the developed world. The U.S. is also one of the few countries that makes its companies pay that rate on all their worldwide income…More than 50 U.S. companies have reincorporated in low-tax countries since 1982, including more than 20 since 2012.”

Ed Rogers, writing in the Washington Post, notes: “I don’t think there has been a president in my lifetime who has been more hostile to business than Obama. I could be corrected, but I don’t think anyone in the president’s Cabinet has ever started a business, and I would doubt that many of his senior staffers have either. At the end of the day, Obama doesn’t seem to have much respect for what it takes to start a business. And this cratering in the number of start-ups under his administration reminds us of the gratuitous smackdown he gave business owners everywhere during the 2012 campaign when he pointedly said, “If you’ve got a business, you didn’t build that.”

The U.S. has declined in the Index of Economic Freedom  which notes: Americans continue to lose economic freedom. Following declines in seven of the past eight years, the United States this year has equaled its worst score ever in the Index of Economic Freedom. Ratings for labor freedom, business freedom, and fiscal freedom have flagged notably, and the regulatory burden is increasingly costly… America’s historically vibrant entrepreneurial growth is significantly hampered by intrusive, expensive, and often ineffective government policies in areas ranging from health care to energy to education. Government favoritism toward entrenched interests has hurt innovation and contributed to a lackluster recovery and stagnant income growth… The regulatory burden continues to increase. Over 180 new major federal regulations have been imposed on business operations since early 2009 with estimated annual costs of nearly $80 billion.”

Finally, The Census Bureau reports that home ownership rates have dropped to a 48 year low. In 2009, when President Obama took office, home ownership stood at 67.3%.  The latest figure is 63.5%.